July 22, 2019
Shedding Some Light on New Home Lighting Trends
A quick web search on current trends in lighting will score a lot of hits and a lot of descriptors – “modern,” “metallic,” “industrial,” “eco-friendly,” “natural,” and others. A quick look into Home Innovation’s Annual Builder Practices Report reveals some deeper dimension of lighting trends. For example, there are far more lighting fixtures being installed on new homes now compared to a decade ago, both interior and exterior. Some configurations have seen more growth than others.
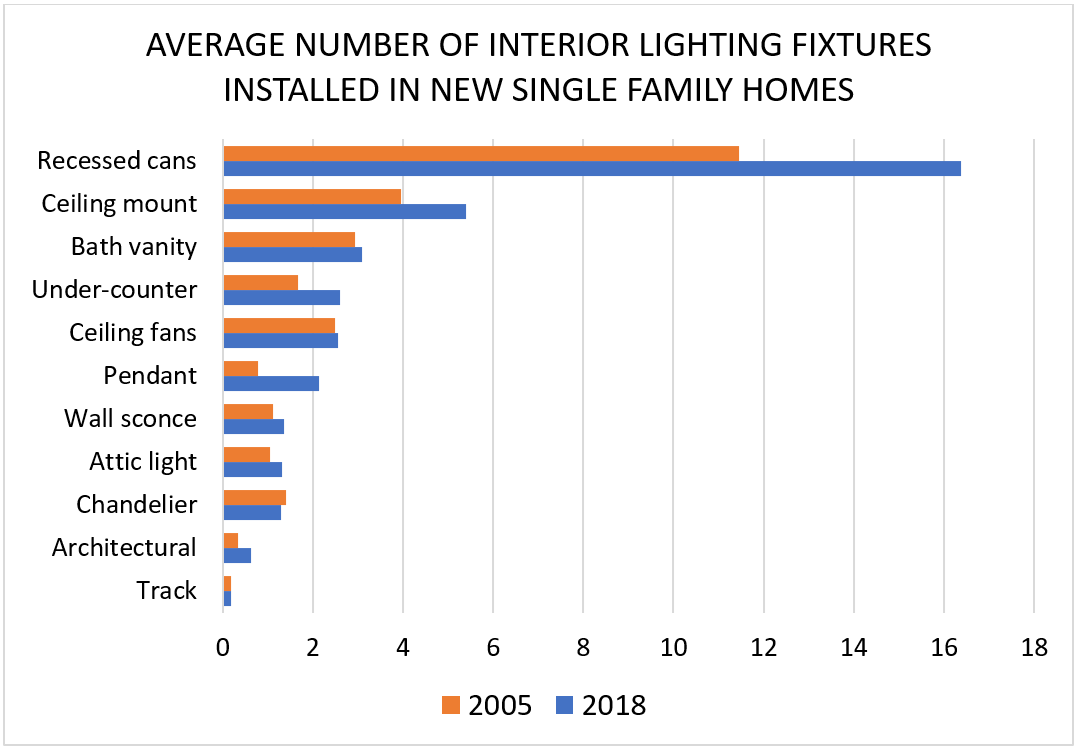
Comparing Builder Practices Reports data from 2005 to 2018, the average number of interior lighting fixtures per new single-family detached house grew from 27 to 37 fixtures. In multifamily, the number grew from 16 interior fixtures per unit to 25 fixtures in the same period.
This means that lighting has gotten the attention of home builders as a key differentiator — it’s no longer expected to be just builder-grade fixtures that the homebuyer can plan to update once they learn how unspectacular their new home lighting is.
The graph below is a comparison between the average number of interior fixtures installed in new homes in 2005 and 2018 for each fixture style, based on our Builder Practices Reports:

Source: 2019 Annual Builder Practices Survey, Home Innovation Research Labs
As you can see, there was significant growth in recessed ceiling lights, under counter lighting, and pendants. On the opposite end of the market growth spectrum were bath vanity lighting, track lighting, and wall sconces. A few factors have markedly influenced lighting choices by new home builders:
- Ceilings are now, on average, taller in new homes than they were in the mid-2000s. There are more 9-foot ceilings in single-family homes than 8-foot, giving a little more room for suspended lights, such as pendants.
- LED lighting technology has created opportunities for fixture manufacturers and designers to innovate — compared to older technologies, they can be small, more durable, more energy efficient, and have very good color rendition.
- Automated lighting control is now a common feature in homes, and our mobile handsets and cellular technology gives occupants the ability to control lighting from anywhere.
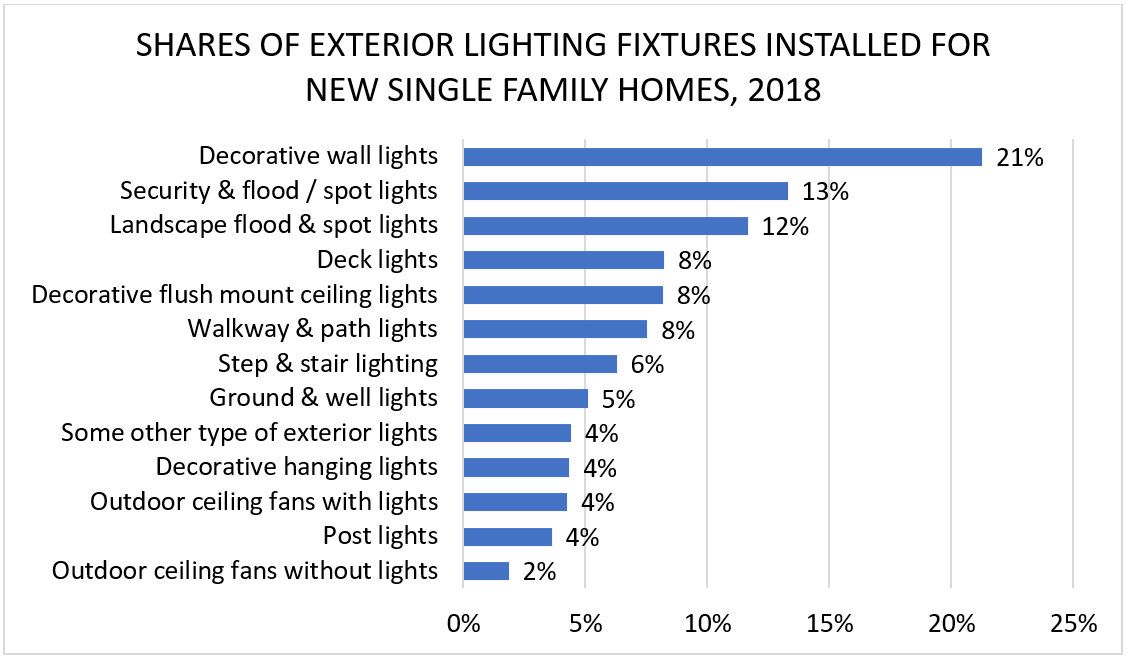
Outdoor lighting has also experienced a bit of a renaissance, increasing from about 5 fixtures per house, on average, to 11 during the 2005 to 2018 period. This seems to respond to the increased attention given to outdoor living space and features over the past decade. The graph below summarizes the percent of total exterior lighting fixtures on the average new single-family house by style or purpose.

Source: 2019 Annual Builder Practices Survey, Home Innovation Research Labs
Looking back at the 2005 Builder Practices Lighting Report, the average number of walkway, path, and stair light fixtures has doubled. Flood and spot lamps have nearly tripled. On the other hand, while post-mounted lights have seen modest gain, they seem to have missed the lighting “boom.”
The Builder Practices Survey tracks many other product categories, including:
Appliances | Bathroom Accessories | Beams & Headers | Cabinets
Countertops | Deck & Porch Railings | Ducts | Exterior Doors | Faucets
Fencing & Landscape Walls | Fire Sprinklers | Finish Flooring | Foundations
Garage Doors | Home Electronics | Home Mechanical Ventilation
Standby Generators | House Wrap & Radiant Barriers | HVAC Systems
Infrastructure | Insulation | Interior Doors | Interior Finish Materials | Lighting
Outdoor Structures | Patio Doors | Plumbing Fixtures | Plumbing Piping
Roofing | Roofing Underlayment | Sheathing - Floor, Roof, Wall
Siding & Exterior Finish | Soffit, Fascia, & Exterior Trim
Structural Systems - Floor, Roof, Wall | Swimming Pools | Underlayment
Vapor Retarders in Walls & Ceilings | Windows
Why Trust Home Innovation’s Builder Practices Reports?
If you’re new to our annual reports – either Builder or Consumer Practices – you should know they are far more than just summary tabulations of a national survey of home builders. We employ a robust market demand modeling methodology that compiles volume and type of products and materials purchased. We report market demand for single- and multifamily properties separately.
We’re also providing more options than ever in data format. The large survey sample size allows data subscribers to get a very granular look into county, metro area, state, and regional markets for new home products purchases. This year, the Builder Practices Reports will be available in both tabular and database formats that give you more analysis options, including analysis via business analytics and mapping software.
Would you like to be further illuminated on these or other product trends? Get in touch! You can contact Ed Hudson, our director of market research, online or by calling 301.430.6305.
Back to Top