June 5, 2017
Insulation Usage Patterns Linked to Home Type, Pricepoint, Geography, and Builder Size
Like most data points in the building industry, insulation material usage varies widely by geographic area, the size and type of builder, and types of homes. The national survey of builders we conducted in February, 2017 sheds further light on usage patterns—confirming some stereotypes about insulation usage in new homes, but it also seems to refute others, lending insight into the market for insulation materials and systems.

Source: Home Innovation Research Labs, February 2017 Omnibus Survey
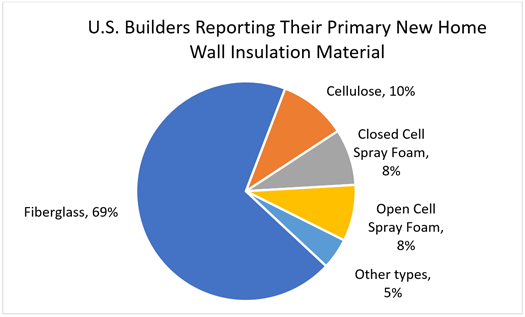
Not surprisingly, the survey results reveal that fiberglass batt continues to be the most popular material by a large margin. Looking deeper into the results, we find that insulation material selection varies more by geographic area than by builder size or price-point of home. For example, builders in the West are more likely than others to use fiberglass insulation in walls (78%), and Northeast builders are the least likely (64%). On the other hand, Northeast builders are most likely to report using spray foam (27%), and builders from the West are least likely (5%) to use it. Spray foam is more popular among builders of Custom (19%) and Luxury (21%) homes as well—but only slightly more than the 16% U.S. average.
Looking at R-value in single-family homes, builders of move-up homes report lower R-values in their homes than either Starter or Luxury home builders. This reflects a dilemma faced by many builders trying to incorporate energy efficiency in more affordable homes – generally, these households have greater need for lower energy bills, but are less able to pay for energy upgrades. On the other hand, high-end buyers may be less energy bill-conscious, but are more able to afford the energy upgrades. On balance, Luxury homes still have the highest R-value of any price-point category, supporting the belief that energy efficiency upgrades are easiest to sell to high-end builders and homebuyers.
Interestingly, multifamily homes and townhouses have substantially higher R-value (18.5) than single-family homes (17.9) per our survey results. This matches data from previous studies we’ve conducted, where we found the attitudes of multifamily and townhouse occupants to be reflective of more urban and younger buyers and renters with stronger orientations toward a sustainable lifestyle. Also, this likely reflects the higher energy costs in more densely populated areas, such as the urban locations of many multifamily projects.
Obviously, the average R-value of walls also varies by geography as it relates to climate. Average total wall R-values are highest in the Northeast (R-20.4), and lowest in the South (R-16.2). Further, 60 percent of builders in the South Census Region report their typical new home walls have a total R-value of 15 or less, compared to only 3 percent of builders in the Northeast (a factor of 20 difference). But before concluding that high-efficiency wall systems are only relevant in northern latitudes, there’s more data you may want to consider. For the highest R-value category in the study (R-22 and higher), 25 percent of Northeast (and Midwest) builders said this was typical of their homes, and 12 percent of builders in the South said the same. On its face, this seems to reinforce the link between high energy efficiency and colder climates until you consider there are more than DOUBLE the number of homes built in the South than in the Northeast and Midwest combined. This makes the South as large a market for high energy efficient wall systems, or possibly even larger than those colder climate regions.
As energy efficiency becomes increasingly important in our industry, studies like this can help keep suppliers of energy-efficient systems abreast of unmet needs that are often overlooked by traditional, and sometimes erroneous thinking. For more information on the results of this survey, or others that are specific to your business, contact us.
Back to Top