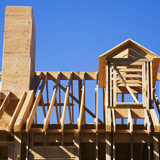
Roofing Underlayment Overview
These reports use incidence rates, household purchase rates for homeowners and renters, and housing stock to produce market demand data and a five-year forecast for residential repair and remodeling purchases. The Roofing Underlayment report contains a summary of purchase volume in square feet for a variety of roofing underlayment material in each State, Metro Area, and County. Market data are reported separately for owner-occupied dwellings and renter-occupied dwellings. Product categories include:
HOUSEHOLDS THAT SPENT MONEY ON: ROOFING UNDERLAYMENT
- Sample Size
- Projected Households
|
TYPE OF PURCHASE
(Households that Spent Money on:)
ROOFING UNDERLAYMENT (Square Feet)
- None
- Traditional asphalt felt
- Synthetic (nailed on)
- Self-sticking (peel and stick)
- Other
- Not sure
|
|
PURCHASED BY A PROFESSIONAL CONTRACTOR (Square Feet)
INSTALLED BY A PROFESSIONAL CONTRACTOR (Square Feet)
PLACE OF PURCHASE
(Square Feet)
- Home improvement warehouse or big box store
- Hardware store
- Specialty Store
- Lumber yard
- Discount store
- Other
- Not sure
PLACE OF PURCHASE – HOME IMPROVEMENT WAREHOUSE OR BIG BOX STORE BREAKOUT (Square Feet)
- Home Depot
- Kent
- Lowe’s
- Menards
- RONA
- Other
|
NEW HOMES DATA

We've got new construction data too! Each year, Home Innovation Labs surveys builders nationwide to document home sizes, designs, styles, and material selections. With 40+ categories of new construction reports one is sure to fit your needs.
New Construction
Get a Custom Report
Call to speak with one of our market research experts about a custom report.
301.430.6305